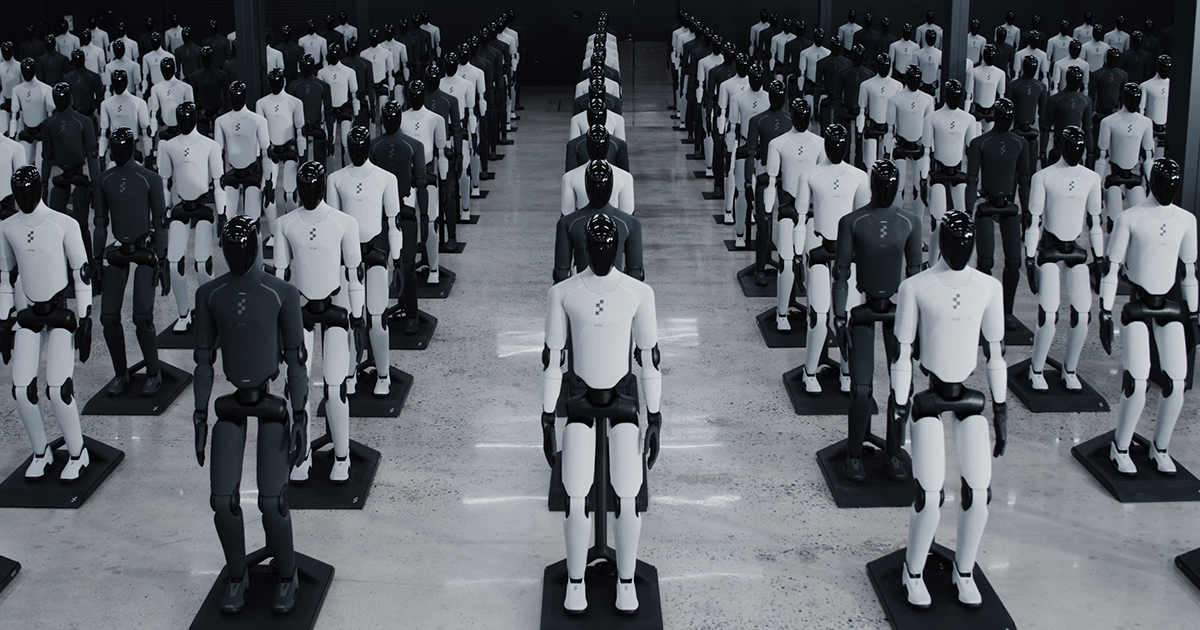
Humanoid robotics has a recurring failure mode: great demos, weak scaling. Figure’s April 29, 2026 update claims it just cleared the manufacturing hurdle by ramping BotQ production 24×.
Watch: the 1 robot/hour milestone
Figure says it demonstrated a cadence of 1 humanoid robot per hour. These clips show fleet scale and the end-of-line flow.
Key facts (from Figure)
- Output: over 350 third-generation humanoid robots shipped.
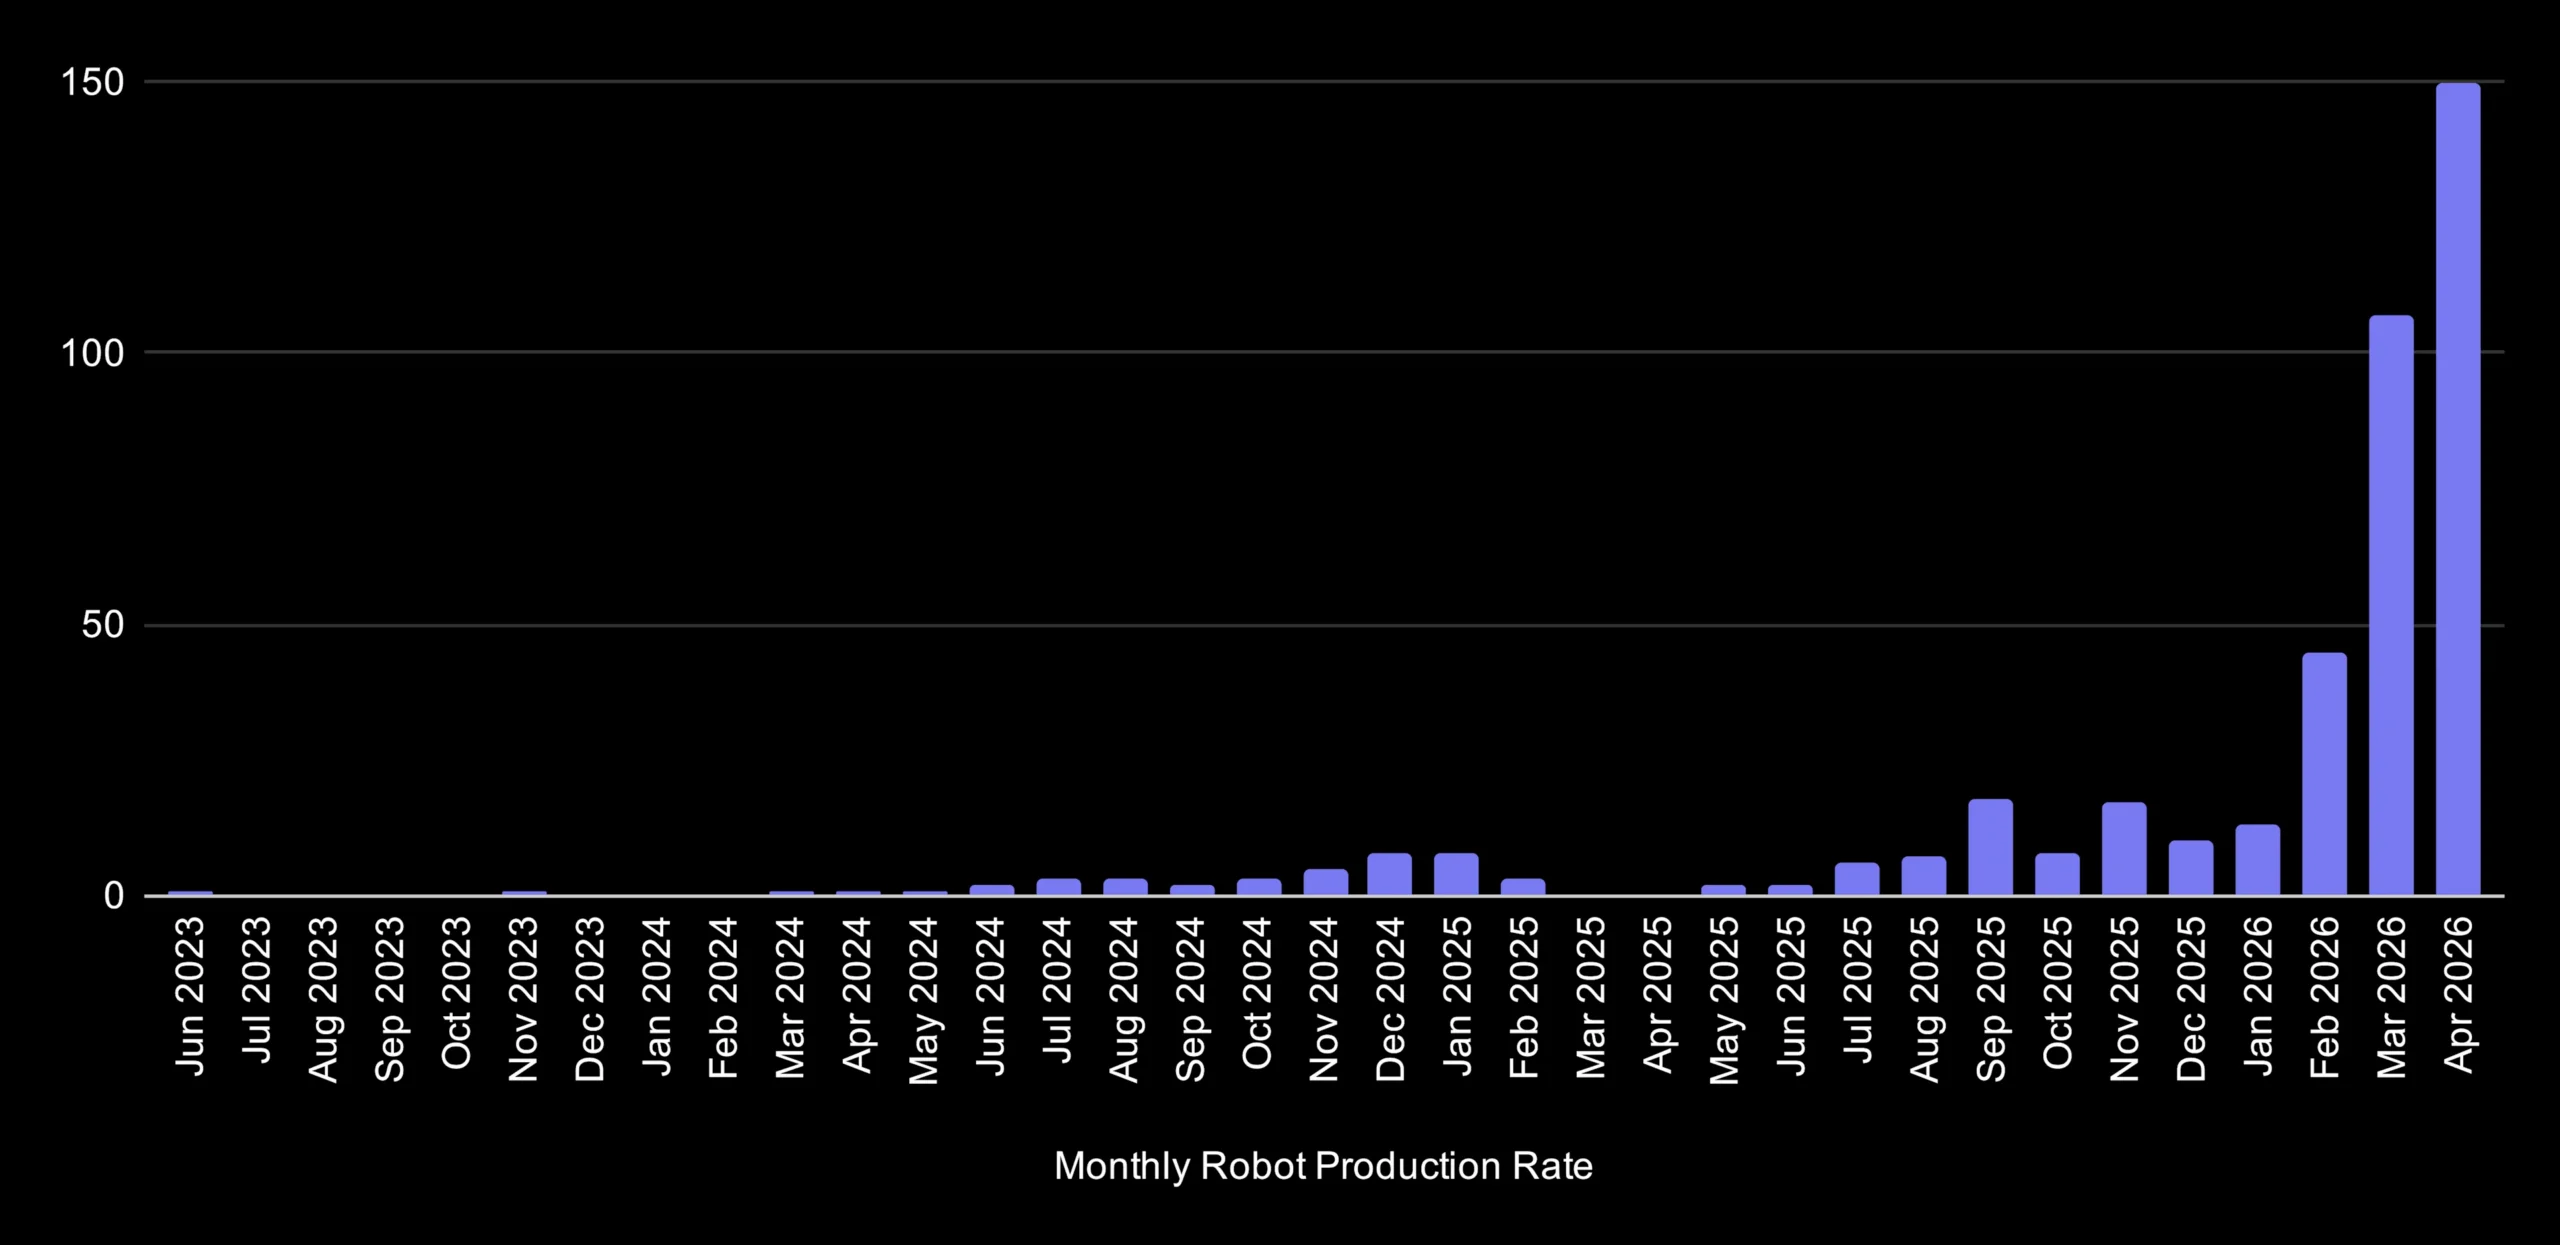
- Rate: production increased from 1 Figure 03/day to 1/hour (a 24× throughput jump) in under 120 days.
- Manufacturing ops: custom manufacturing execution software across 150+ networked workstations; 50+ in-process inspection points.
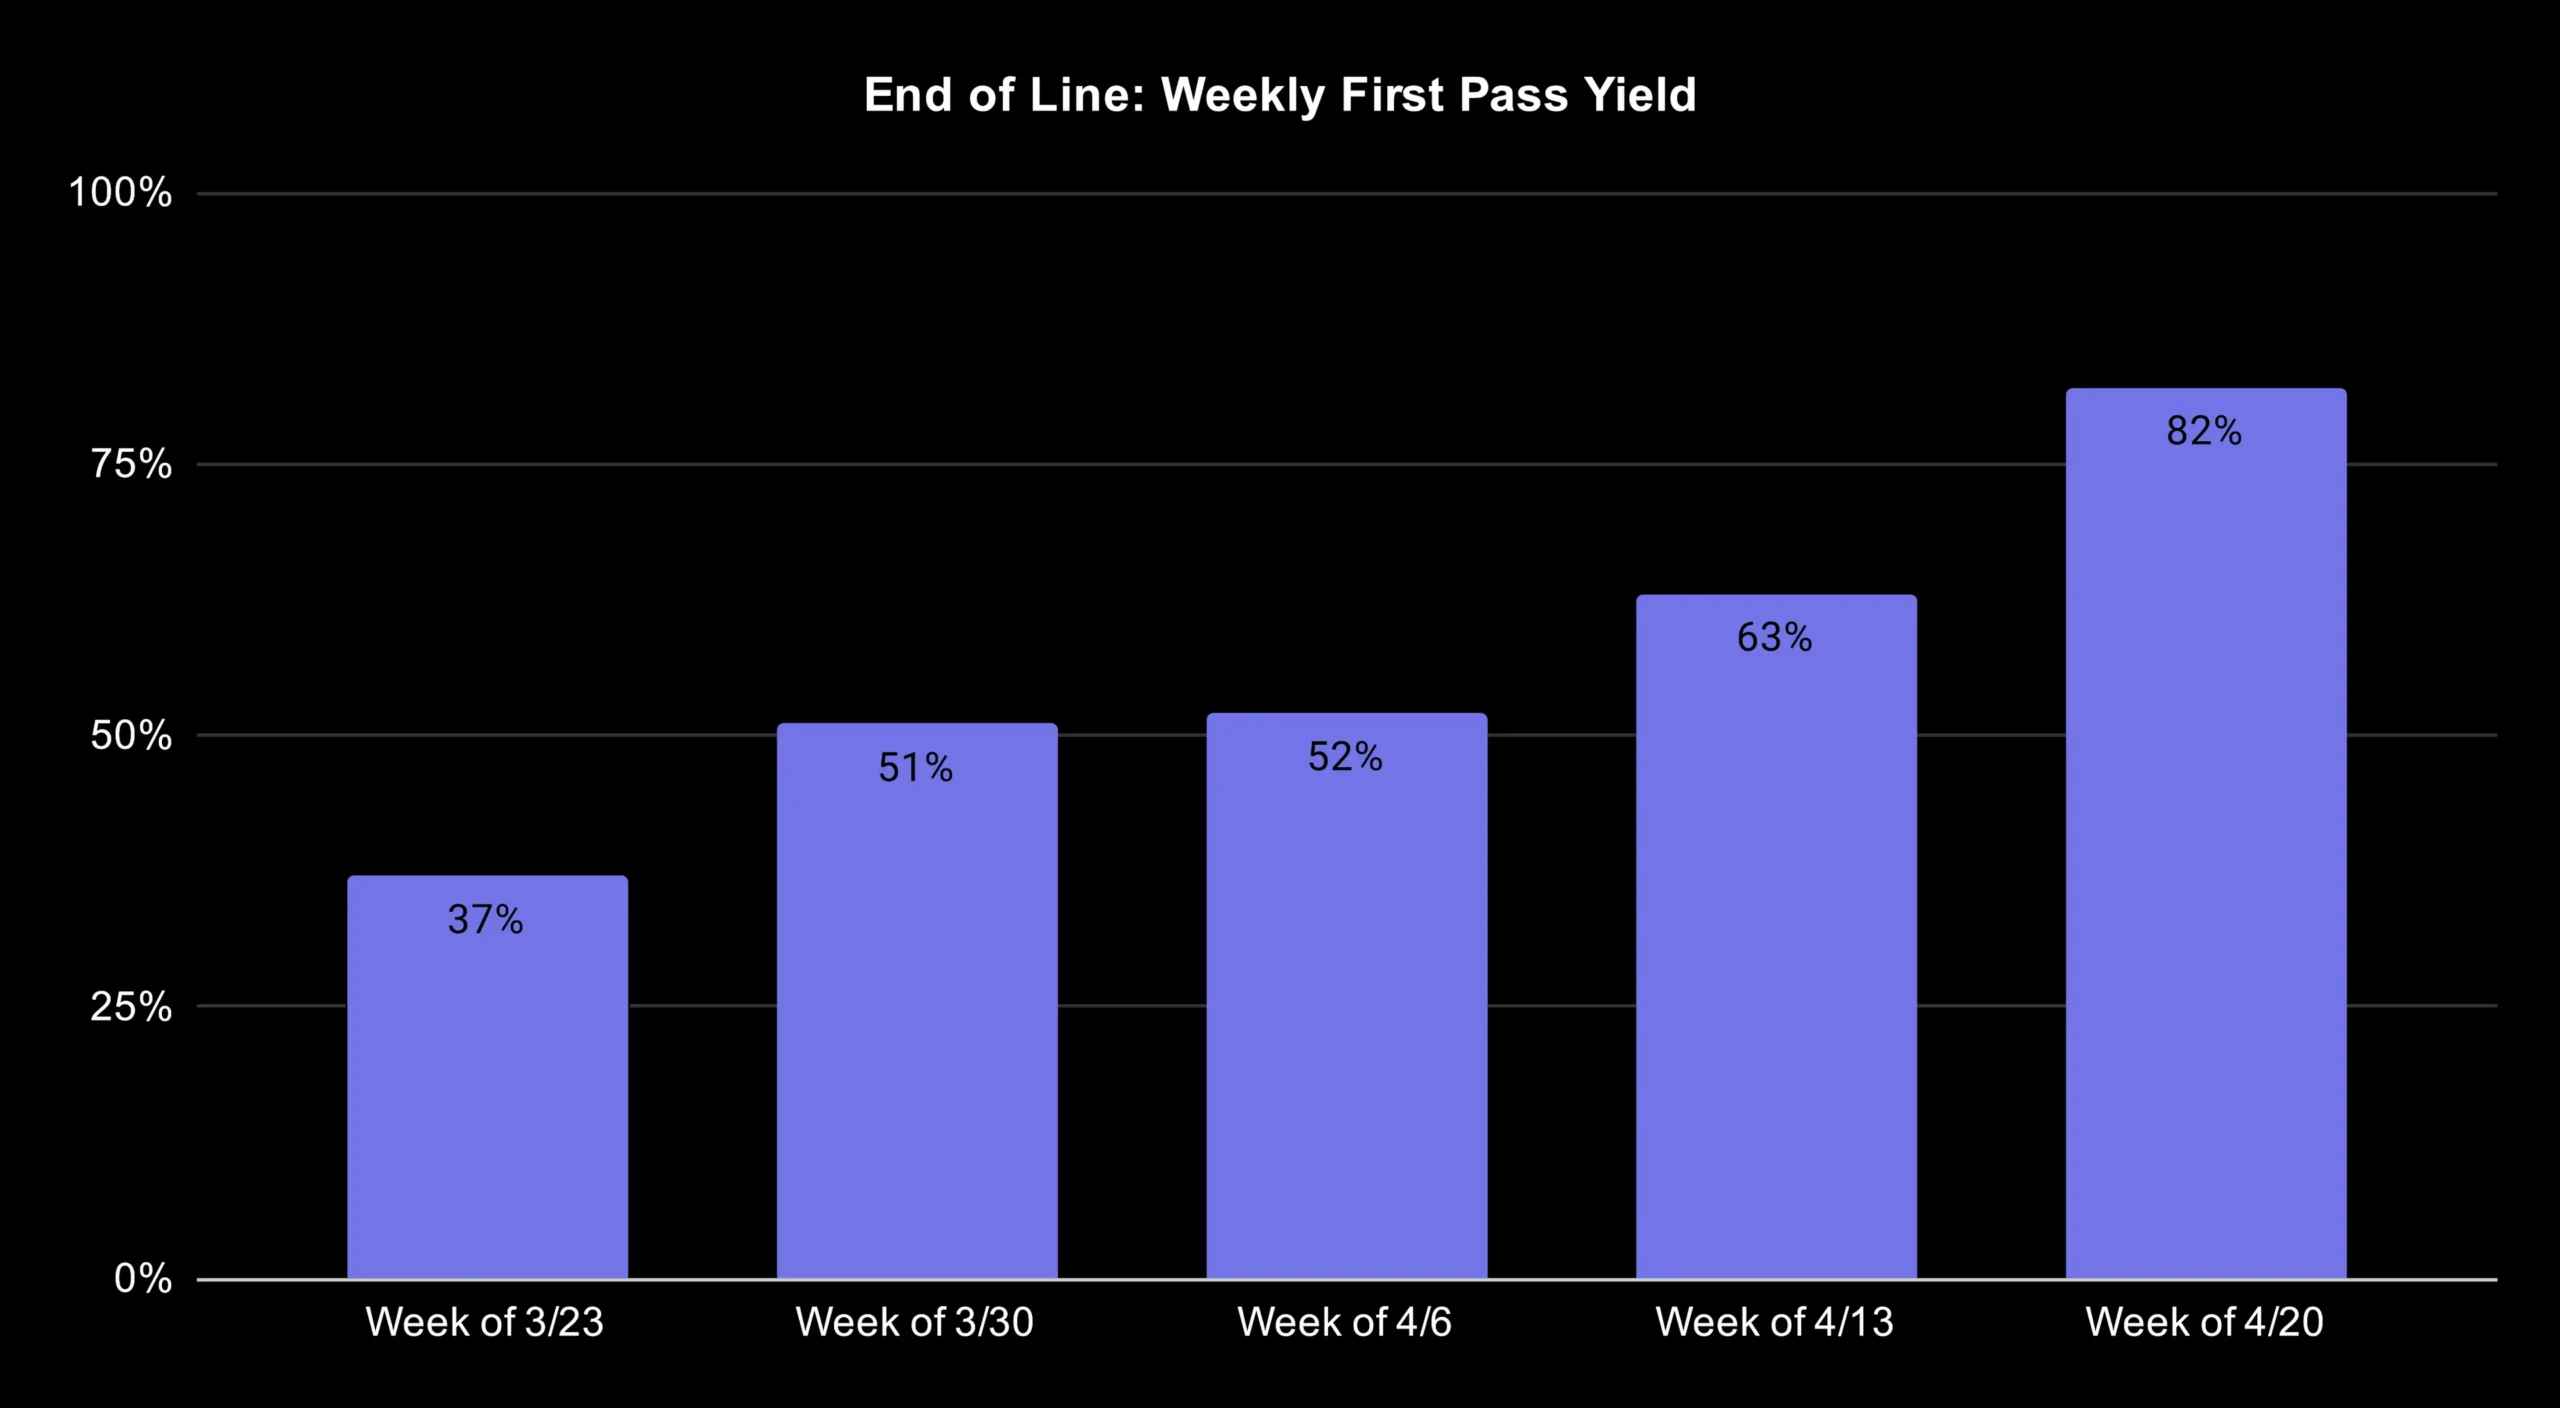
- Quality: end-of-line first pass yield >80% (improving weekly); battery line first-pass yield 99.3% with 500+ battery packs shipped.
- Component scale: 9,000+ actuators produced across 10+ SKUs.
Why 1 robot/hour matters more than the headline
The real strategic implication is not a PR number—it’s fleet hours. Every additional robot is a data-collection engine. More identical hardware in the field means faster discovery of the long-tail of failures (hardware + software), faster iteration, and a tighter feedback loop between deployment and engineering.
Operational moat: fleet management + OTA
Figure frames the next bottleneck as orchestration: diagnosing failures quickly, building fallback ladders, and running fleet-wide upgrades. If those systems are real, they are as defensible as the robot itself—because they turn ‘more robots’ into ‘more learning’.
What to be skeptical about
- Cycle time vs sustained rate: Figure says it has “demonstrated” the 1 robot/hour cycle time; that’s not the same as steady-state weekly output.
- Unit economics: the update does not disclose cost, gross margin, or field service cost per robot-hour.
- Commercial utilization: “fleet” can mean many internal robots before large revenue-bearing deployments.